Norwich City Council elections
One third of the Norwich City Council in Norfolk, England is elected each year. Since the last boundary changes in 2019, 39 councillors have been elected from 13 wards.[1]
Council history
For the majority of its history, the council has been under Labour control, with the party having held a majority of seats from 1973-2000, and again from 2012-2023. Between the 2023 and 2024 election, 3 Labour councillors resigned from the party to sit as Independents, citing the direction of the party under the leadership of Keir Starmer. While remaining the largest party, this caused Labour to lose its majority for the first time since 2011, pushing the council to no overall control.
The Liberal Party (a predecessor party to the Liberal Democrats) first gained representation on the council following the 1980 election, with a single seat. After the Liberal Party and SDP merged to form the Liberal Democrats (then SLD) in 1988, the party made steady gains in both seats and vote share, culminating in them winning a majority of seats at the 2002 and 2003 elections.
However, the ascendancy of the Liberal Democrats was cut short, as the Green Party began winning seats on the council at the 2002 election. Rapid growth over the next decade increased the number of Green councillors from 2 in 2002, to 15 in 2012. This was primarily at the expense of the Liberal Democrats, whose seat numbers collapsed, and ultimately led to the Greens replacing them as a leading party on the council.
The Conservative Party won representation on the council from the inaugural 1973 election, providing the principal opposition to Labour from 1973-1986. However, their seat count began to decline from the 1983 election, and they were eventually usurped by the Liberal Democrats. They lost representation on the council at the 1996 election. Regaining seats in the 2000 election, they were again represented on the council until the 2012 election, when they lost all their seats. Since then, they have failed to win any seats and remain an extra-parliamentary opposition.
Council elections
- 1973 Norwich City Council election
- 1976 Norwich City Council election
- 1979 Norwich City Council election (New ward boundaries)[2]
- 1980 Norwich City Council election
- 1982 Norwich City Council election
- 1983 Norwich City Council election
- 1984 Norwich City Council election
- 1986 Norwich City Council election
- 1987 Norwich City Council election
- 1988 Norwich City Council election
- 1990 Norwich City Council election
- 1991 Norwich City Council election
- 1992 Norwich City Council election
- 1994 Norwich City Council election
- 1995 Norwich City Council election
- 1996 Norwich City Council election
- 1998 Norwich City Council election
- 1999 Norwich City Council election
- 2000 Norwich City Council election
- 2002 Norwich City Council election
- 2003 Norwich City Council election
- 2004 Norwich City Council election (New ward boundaries reduced the number of seats by 9)[3][4]
- 2006 Norwich City Council election
- 2007 Norwich City Council election
- 2008 Norwich City Council election
- 2010 Norwich City Council election (By-elections in all 13 wards were held in September following a High Court ruling)[5]
- 2011 Norwich City Council election
- 2012 Norwich City Council election
- 2014 Norwich City Council election
- 2015 Norwich City Council election
- 2016 Norwich City Council election
- 2018 Norwich City Council election
- 2019 Norwich City Council election (New ward boundaries)
- 2021 Norwich City Council election
- 2022 Norwich City Council election
- 2023 Norwich City Council election
- 2024 Norwich City Council election
Council composition
| Year | Labour | Liberal Democrats[a] | Green | Conservative | Independents & Others |
Council control after election | ||
|---|---|---|---|---|---|---|---|---|
| Local government reorganisation; council established (48 seats) | ||||||||
| 1973 | 37 | 0 | – | 11 | 0 | Labour | ||
| 1976 | 36 | 0 | 0 | 12 | 0 | Labour | ||
| New ward boundaries | ||||||||
| 1979 | 39 | 0 | 0 | 9 | 0 | Labour | ||
| 1980 | 37 | 1 | 0 | 9 | 1 | Labour | ||
| 1982 | 38 | 1 | 0 | 9 | 0 | Labour | ||
| 1983 | 37 | 2 | 0 | 9 | 0 | Labour | ||
| 1984 | 39 | 2 | 0 | 7 | 0 | Labour | ||
| 1986 | 38 | 2 | 0 | 4 | 0 | Labour | ||
| 1987 | 36 | 9 | 0 | 3 | 0 | Labour | ||
| 1988 | 37 | 9 | 0 | 2 | 0 | Labour | ||
| 1990 | 37 | 9 | 0 | 2 | 0 | Labour | ||
| 1991 | 38 | 7 | 0 | 3 | 0 | Labour | ||
| 1992 | 36 | 9 | 0 | 3 | 0 | Labour | ||
| 1994 | 36 | 10 | 0 | 2 | 0 | Labour | ||
| 1995 | 37 | 10 | 0 | 1 | 0 | Labour | ||
| 1996 | 37 | 11 | 0 | 0 | 0 | Labour | ||
| 1998 | 35 | 13 | 0 | 0 | 0 | Labour | ||
| 1999 | 33 | 15 | 0 | 0 | 0 | Labour | ||
| 2000 | 26 | 21 | 0 | 1 | 0 | Labour | ||
| 2002 | 19 | 26 | 2 | 1 | 0 | Liberal Democrats | ||
| 2003 | 15 | 30 | 2 | 1 | 0 | Liberal Democrats | ||
| New ward boundaries; seats reduced from 48 to 39 | ||||||||
| 2004 | 15 | 18 | 5 | 1 | 0 | No overall control | ||
| 2006 | 16 | 12 | 9 | 2 | 0 | No overall control | ||
| 2007 | 15 | 11 | 10 | 3 | 0 | No overall control | ||
| 2008 | 15 | 6 | 13 | 5 | 0 | No overall control | ||
| 2010 | 16 | 5 | 14 | 4 | 0 | No overall control | ||
| 2011 | 18 | 4 | 15 | 2 | 0 | No overall control | ||
| 2012 | 21 | 3 | 15 | 0 | 0 | Labour | ||
| 2014 | 21 | 3 | 15 | 0 | 0 | Labour | ||
| 2015 | 22 | 3 | 14 | 0 | 0 | Labour | ||
| 2016 | 26 | 3 | 10 | 0 | 0 | Labour | ||
| 2018 | 31 | 3 | 5 | 0 | 0 | Labour | ||
| New ward boundaries | ||||||||
| 2019 | 27 | 3 | 9 | 0 | 0 | Labour | ||
| 2021 | 26 | 3 | 10 | 0 | 0 | Labour | ||
| 2022 | 25 | 3 | 11 | 0 | 0 | Labour | ||
| 2023 | 23 | 3 | 13 | 0 | 0 | Labour | ||
| 2024 | 19 | 3 | 15 | 0 | 2 | No overall control | ||
Result maps
-
 1980 results map
 -
 1982 results map
 -
 1983 results map
 -
 1984 results map
 -
 1986 results map
 -
 1987 results map
 -
 1988 results map
 -
 1990 results map
 -
 1991 results map
 -
 1992 results map
 -
 1994 results map
 -
 1995 results map
 -
 1996 results map
 -
 1998 results map
 -
 1999 results map
 -
 2000 results map
 -
 2002 results map
 -
 2003 results map
 -
 2004 results map
 -
 2006 results map
 -
 2007 results map
 -
 2008 results map
 -
 2010 results map
 -
2011 results map
-
2012 results map
-
2014 results map
-
 2015 results map
 -
 2016 results map
 -
 2018 results map
 -
 2019 results map
 -
 2021 results map
 -
 2022 results map
 -
 2023 results map
 -
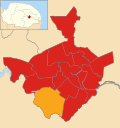
 2024 results map


By-election results
1994-1998
| Party | Candidate | Votes | % | ±% | |
|---|---|---|---|---|---|
| Labour | 956 | 52.7 | |||
| Liberal Democrats | 637 | 35.1 | |||
| Conservative | 220 | 12.1 | |||
| Majority | 319 | 17.6 | |||
| Turnout | 1,813 | 32.6 | |||
| Labour hold | Swing | ||||
| Party | Candidate | Votes | % | ±% | |
|---|---|---|---|---|---|
| Labour | 2,088 | 56.0 | −8.1 | ||
| Liberal Democrats | 1,226 | 32.9 | +15.9 | ||
| Green | 413 | 11.0 | +1.1 | ||
| Majority | 862 | 13.1 | |||
| Turnout | 3,727 | ||||
| Labour hold | Swing | ||||
1998-2002
| Party | Candidate | Votes | % | ±% | |
|---|---|---|---|---|---|
| Liberal Democrats | 755 | ||||
| Liberal Democrats | 738 | ||||
| Labour | 431 | ||||
| Labour | 407 | ||||
| Conservative | 144 | ||||
| Conservative | 142 | ||||
| Green | 81 | ||||
| Green | 74 | ||||
| Turnout | 2,772 | 22.0 | |||
| Liberal Democrats hold | Swing | ||||
2006-2010
| Party | Candidate | Votes | % | ±% | |
|---|---|---|---|---|---|
| Liberal Democrats | Carl Mayhew | 789 | 46.1 | +11.7 | |
| Labour | Barbara James | 702 | 41.0 | −0.7 | |
| Green | Susan Curran | 115 | 6.7 | −5.6 | |
| Conservative | David Mackie | 106 | 6.2 | −5.4 | |
| Majority | 87 | 5.1 | |||
| Turnout | 1,712 | 24.4 | |||
| Liberal Democrats hold | Swing | ||||
| Party | Candidate | Votes | % | ±% | |
|---|---|---|---|---|---|
| Conservative | Andrew Wiltshire | 915 | 35.8 | −10.2 | |
| Labour | Jo Storie | 761 | 29.8 | −5.7 | |
| Liberal Democrats | Dave Thomas | 686 | 26.8 | +19.8 | |
| Green | Christine Way | 193 | 7.6 | −3.9 | |
| Majority | 154 | 6.0 | |||
| Turnout | 2,555 | 31.0 | |||
| Conservative hold | Swing | ||||
2010-2014
| Party | Candidate | Votes | % | ±% | |
|---|---|---|---|---|---|
| Labour | Marion Frances Maxwell | 884 | 59.3 | −2.5 | |
| Conservative | Evelyn Jean Collishaw | 259 | 17.4 | −1.5 | |
| UKIP | Glenn Stuart Tingle | 232 | 15.6 | +15.6 | |
| Green | Judith Ford | 73 | 4.9 | −8.4 | |
| Liberal Democrats | Michael Anthony Sutton-Croft | 42 | 2.8 | −3.3 | |
| Majority | 625 | ||||
| Turnout | |||||
| Labour hold | Swing | ||||
| Party | Candidate | Votes | % | ±% | |
|---|---|---|---|---|---|
| Green | Andrew Boswell | 1,121 | 56.0 | −3.5 | |
| Labour | Layla Dickerson | 599 | 29.9 | +4.7 | |
| Liberal Democrats | Helen Anne Whitworth | 174 | 8.7 | +2.4 | |
| Conservative | Alexandra Rhiannon Davies | 108 | 5.4 | −3.6 | |
| Majority | 522 | ||||
| Turnout | |||||
| Green hold | Swing | ||||
| Party | Candidate | Votes | % | ±% | |
|---|---|---|---|---|---|
| Green | Simeon Jackson | 1,152 | 46.1 | +3.3 | |
| Labour | Tony Waring | 861 | 34.5 | −3.0 | |
| Conservative | Samuel Stringer | 308 | 12.3 | +0.8 | |
| Liberal Democrats | Jeremy Hooke | 177 | 7.1 | −1.1 | |
| Majority | 291 | 11.6 | |||
| Turnout | 2,498 | ||||
| Green hold | Swing | ||||
| Party | Candidate | Votes | % | ±% | |
|---|---|---|---|---|---|
| Labour | Richard Lawes | 689 | 31.5 | −30.4 | |
| Reform UK | Nick Taylor | 688 | 31.4 | New | |
| Green | Tony Arthur Park | 430 | 19.6 | +8.0 | |
| Conservative | Anthony Daniel Little | 281 | 12.8 | −4.8 | |
| Liberal Democrats | Sean Timothy Bennett | 102 | 4.7 | −4.2 | |
| Majority | 1 | 0.1 | |||
| Turnout | 2,190 | ||||
| Labour hold | Swing | ||||
| Party | Candidate | Votes | % | ±% | |
|---|---|---|---|---|---|
| Green | Ian Clifford Stutely | 1,087 | 54.6 | −7.3 | |
| Reform UK | Craig Barker | 381 | 19.1 | New | |
| Labour | George Andrew Heaney | 312 | 15.7 | −10.8 | |
| Conservative | Edith Jones | 106 | 5.3 | −2.9 | |
| Liberal Democrats | Gordon Richard Dean | 105 | 5.3 | +1.8 | |
| Majority | 706 | 35.5 | |||
| Turnout | 1,991 | ||||
| Green hold | Swing | ||||
| Party | Candidate | Votes | % | ±% | |
|---|---|---|---|---|---|
| Green | Jenny Knight | 1,280 | 54.0 | −4.4 | |
| Labour | Paul Guille | 525 | 22.2 | −8.6 | |
| Reform UK | Valerie Brind | 367 | 15.5 | +11.8 | |
| Liberal Democrats | Marlowe North | 99 | 4.2 | +1.6 | |
| Conservative | Simon Mark Jones | 85 | 3.6 | −0.9 | |
| Independent | His Excellency Freeman | 13 | 0.5 | New | |
| Majority | 755 | 31.8 | |||
| Turnout | 2,369 | ||||
| Green hold | Swing | ||||
Notes
- ^ Includes totals for the predecessors of the Liberal Democrats, the Liberal Party and SDP (both of which participated in the Alliance).
References
- ^ "How the council works". Norwich City Council. Archived from the original on 26 April 2009. Retrieved 17 September 2009.
- ^ The City of Norwich (Electoral Arrangements) Order 1977
- ^ "Norwich council". * BBC News Online. Retrieved 17 September 2009.
- ^ legislation.gov.uk - The City of Norwich (Electoral Changes) Order 2002. Retrieved on 4 October 2015.
- ^ "September by-elections for Exeter and Norwich". BBC. 19 July 2010. Retrieved 3 May 2016.
- ^ "Lib Dems celebrate by-election win". Eastern Daily Press. 27 July 2006. Retrieved 17 September 2009.
- ^ "Bowthorpe ward by-election results". Norwich City Council. Archived from the original on 23 March 2009. Retrieved 17 September 2009.
- ^ a b "By-elections results December 2012". Norwich City Council. Archived from the original on 28 January 2013. Retrieved 15 February 2013.
- ^ "Local Elections Archive Project — Mancroft Ward". www.andrewteale.me.uk. Retrieved 27 December 2023.
- ^ a b c "Norwich City Council by-election results - 1 May 2025". www.norwich.gov.uk. Retrieved 1 May 2025.